The Census Bureau released another great time suck on Thursday: Interactive maps with data on the 16.8 million Americans who moved from one county to another between 2007 and 2011. Type in any county and you get a map of where new residents are coming from (in orange) and where the people who used to live down the street might have disappeared to (in blue).
Be sure to click the “Show data table” tab to get the real numbers. New York County (Manhattan), for example, gained 2,059 residents from Nassau County on Long Island, perhaps as part of the movement back to central cities. But it lost 9,277 residents to the Bronx, perhaps due to skyrocketing rent in downtown areas. Clark County (Las Vegas) in Nevada picked up 4,668 people from Los Angeles County, which is a major immigrant gateway, but it lost 1,513 residents to Washoe County, home of the less crowded city of Reno.
The most common county-to-county moves were from Los Angeles to San Bernardino counties in California (41,764 people), and from Los Angeles to next-door Orange County (40,764), according to the Census Bureau press release. Also from the press release:
There was a large net influx of movers to the Southwest and parts of Florida and Colorado. Counties experiencing a net loss were concentrated along the Southern California coast, South Florida, and the New York metro area.There were relatively large flows of graduate or professional degree holders from Los Angeles to Manhattan, the District of Columbia to Manhattan, the District of Columbia to Cook County, Ill., Manhattan to Middlesex County, Mass., Cook to Manhattan, Manhattan to Los Angeles and Middlesex to Manhattan.
About 7,850 graduate or professional degree holders moved into Suffolk County (Boston), Mass., during the one-year period. That means that for every 100 residents in the county with this level of education, 9.8 of them moved into the county during the previous year ─ among the highest rates of any large county in the nation. Conversely, for every 100 residents with this level of education, 13.8 moved to a different county, also among the highest rates in the country.
The migration patterns could have political implications, assuming that people bring their politics to their new homes. For example, Orange County, California, was once a Republican stronghold, but it’s moved to the center as it takes in residents from immigrant-rich Los Angeles. Meanwhile, it’s exporting residents to more conservative states like Arizona, Texas, and Utah.

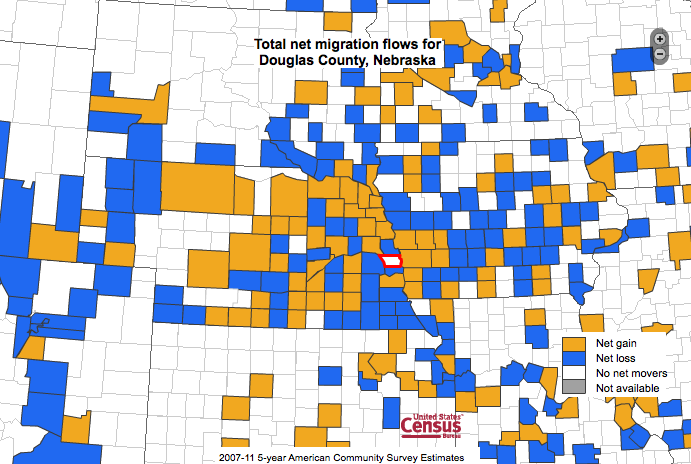
The map on the top of this post shows migration patterns for Douglas County, Nebraska (Omaha!). It seems to be pulling in people from rural Nebraska and spitting them out to next-door Iowa.