
The “Catholic vote” is often described as a bellwether in U.S. politics, falling between left and right extremes and closely mirroring overall public opinion. There is much truth to this characterization, but there is also danger in oversimplification. Referring to the Catholic vote as a bloc also erases some persistent differences between those who attend Mass weekly and occasional churchgoers, and between Hispanic and non-Hispanic Catholics.
There is conflicting evidence over whether a presidential candidate “must” win the Catholic vote to get to the White House; in close elections, it can be impossible to determine for sure who won more Catholic votes.

In its analysis of the 2016 election, the nonpartisan group American National Election Studies found that the overall Catholic vote almost exactly matched the national population in giving the Democratic nominee, Hillary Clinton, a three-point lead in the popular vote. But exit polls had earlier suggested that Republican Donald Trump had won the Catholic vote by either seven points or four points.
Polls agree that white non-Hispanic Catholics voted overwhelmingly for Mr. Trump and Hispanic Catholics voted for Ms. Clinton by an even bigger margin. Is this proof that Hispanic Catholics are turned off by the Republican Party’s policies on immigration—or is the gap also attributable to Hispanic Catholics being more likely to live in large cities and in the West, where the Democratic Party is stronger overall?
Because each poll, and each pollster, has its idiosyncrasies (different sample sizes and margins of error, different ways of asking for religious affiliation, etc.), survey results cannot always be easily compared with each other. A poll with strikingly different results from one taken three months earlier may not indicate a trend at all, but rather different polling methodologies.
Below are summaries of recent polls that compare Catholic voters with the overall U.S. population, and explanations of why they may or may not be important.
Election 2020
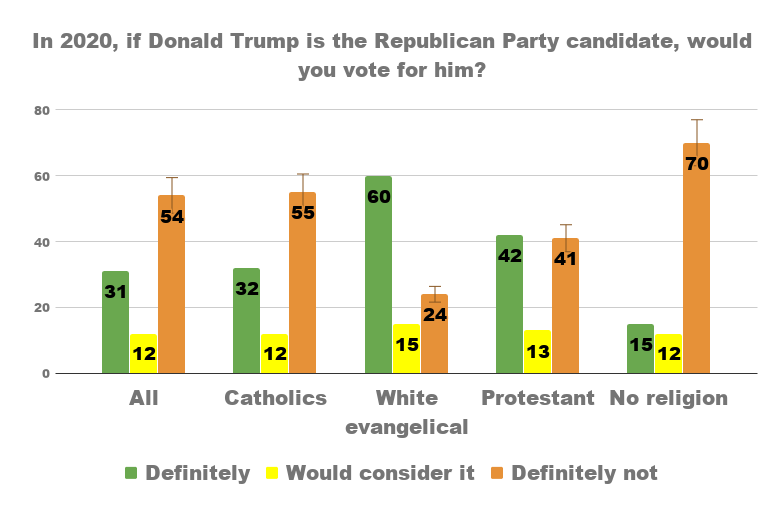
May 21, 2019, Quinnipiac poll: Catholics line up almost precisely with the overall electorate, 55 percent “definitely” will not vote to re-elect President Trump.
A Quinnipiac University poll of 1,078 U.S. voters found that a solid majority of 54 percent will “definitely not” vote to re-elect Donald Trump as president next year, close to the 52 percent who said the same in a Quinnipiac poll released on April 30. There was no significant difference between Catholic voters (55 percent saying “definitely not,” almost the same percentage who voted against him in 2016) and the overall poll sample. Among voters who had no religious affiliation, 70 percent said they would definitely not vote for Mr. Trump, but only 24 percent of white evangelical Protestants said the same.
The poll did not distinguish between white and Hispanic Catholics; however, 64 percent of Hispanics overall said “definitely not,” compared with 49 percent of white non-Hispanics.
Among all respondents who attend weekly religious services, 46 percent said they would definitely not vote for Mr. Trump and 41 percent said they definitely would. Among those who attend religious services less frequently or not at all, Mr. Trump fared worse, with 58 percent opposing and 28 percent supporting the president.
Are the most reliable churchgoers also the most informed about current events? For whatever reason, there was a similar pattern here, with 51 percent of those who claim they follow campaign news “a lot” saying they will definitely vote against Mr. Trump—but 61 percent of those paying little or no attention to campaign news saying the same.
On May 21, President Trump was at an overall disapproval rating of 53.9 percent in RealClearPolitics’s average of recent polls.
Approval ratings for President Trump

March 18, 2019, Pew Research Center poll: White evangelicals remain supportive, but white Catholics are more ambivalent about President Trump.
White evangelical Protestants form the bedrock of support for Donald Trump, with 69 percent approving his performance as president, according to a poll conducted by the Pew Research Center in January. Mr. Trump had a 50 percent approval rating among all Protestants, 36 percent among all Catholics, 20 percent among the religiously unaffiliated and 12 percent among black Protestants.
America’s Michael O’Loughlin reported on the results in greater detail:
When broken down by white and non-white Catholics, the numbers tell a different story.
Support for Mr. Trump among white Catholics has generally hovered around 50 percent since the early days of his presidency, according to Pew, with a high of 55 percent in April 2017 and again in May 2018 and a low of 36 percent in December 2017. Greg Smith, associate director of research at Pew Research Center, told America that support for Mr. Trump from white Catholics has been “pretty consistently within that band.”
The latest survey, conducted in January, found that 44 percent of white Catholics approve of Mr. Trump’s job performance.
Mr. Trump’s support among non-white Catholics is far lower compared to white Catholics.
The January survey found that 26 percent of non-white Catholics approve of the president’s job performance, up from 13 percent in February 2017.
In recent months, the president has boasted that his support from Hispanic Americans has been growing, crediting his continued efforts to build a wall along the U.S.-Mexico border. Experts have cast doubt on that claim, but they say that his support continues to hover around the 29 percent of the Hispanic vote that Mr. Trump won in the 2016 election.
The Quinnipiac poll released on May 21 (see above) did not break out data for white and Hispanic Catholics, but it found that Mr. Trump had an approval rating of 28 percent among Hispanic voters, very close to the 26 percent support among non-white Catholics that Pew reported.
On March 18, the day the Pew study was released, President Trump was at an overall approval rating of 42.6 percent in RealClearPolitics’s average of recent polls.
Partisanship and views on major issues
Jan. 24, 2019, Pew Research Center poll: Catholics are generally as partisan as the rest of U.S. voters.
A Pew Research Center survey tested the idea that fidelity to church teaching would make U.S. Catholics less loyal to the Democratic and Republican parties—and found little evidence for the idea. According to the poll, conducted last year, Catholic Democrats were somewhat more pro-life than other party members: only 64 percent of Catholic Democrats agreed that abortion should be legal in “all or most cases,” compared with 76 percent of all Democrats. But only 55 percent of Catholic Republicans agreed that abortion should be illegal in all or most cases, exactly the same as the 55 percent among all Republicans who took that position.

On other issues, however, Catholics tended to follow their party lines. For example, 64 percent of Catholic Democrats said that “government aid to the poor does more good than harm,” compared with 70 percent of all Democrats. At the same time, 67 percent of Catholic Republicans said that government aid does more harm (by making people “dependent” on assistance), close to the 69 percent of all Republicans who said the same.
Similarly, 91 percent of Catholic Democrats and 93 percent of all Democrats opposed expanding the border wall between the United States and Mexico; 81 percent of Catholic Republicans and 82 percent of all Republicans supported an expansion of the wall.
